







Alphavima Technologies

July 7th, 2026

Fabric Real-Time Intelligence: How to Build a Streaming Pipeline Step by Step

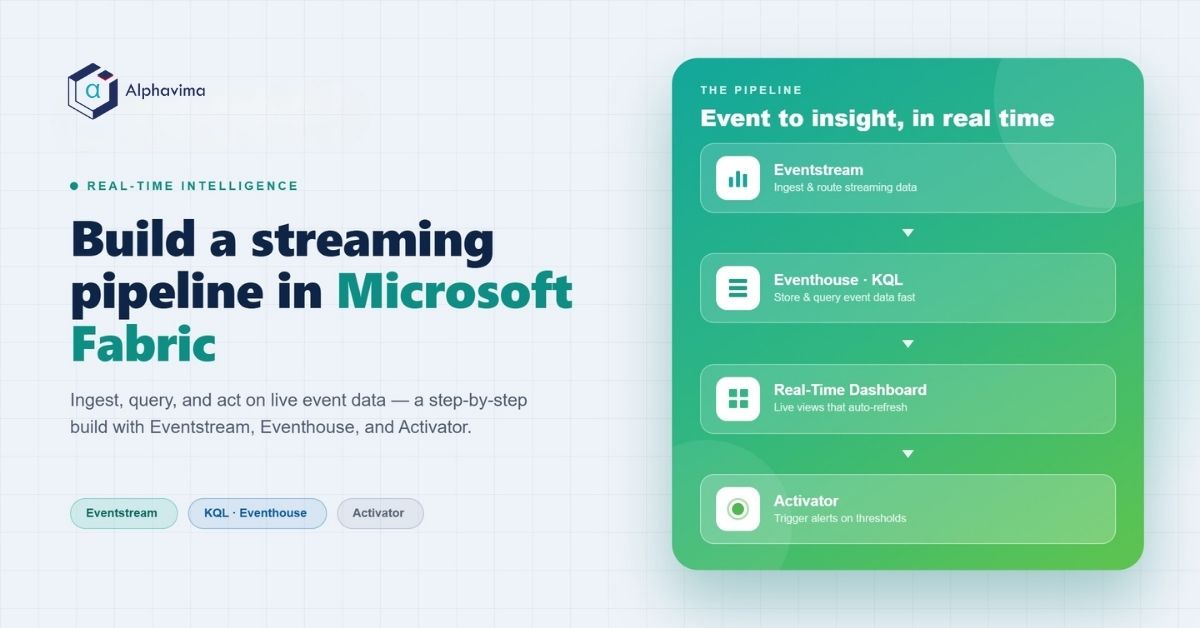
Fabric Real-Time Intelligence gives data teams one place to ingest, query, and act on streaming events as they arrive. Instead of waiting for a nightly batch, you watch live telemetry, route it into storage, and trigger alerts the moment a threshold is crossed. For data and BI practitioners who already work in Microsoft Fabric, it fills the gap between raw event feeds and the analytics layer.

This guide walks through the core building blocks and a numbered build. Along the way, you will see how Eventstream, Eventhouse, and a live dashboard fit together, plus a short KQL query you can adapt. The goal is practical: get a working real-time pipeline running, then layer on alerts.

If you already manage batch pipelines in Fabric, the mental model here is familiar. The difference is timing. Rather than scheduling a load and reporting on it later, you keep a continuous flow open and let the platform process records as they land. That shift changes how you design alerts, how you size storage, and how you think about freshness, so it helps to see each component in context before you wire anything together.
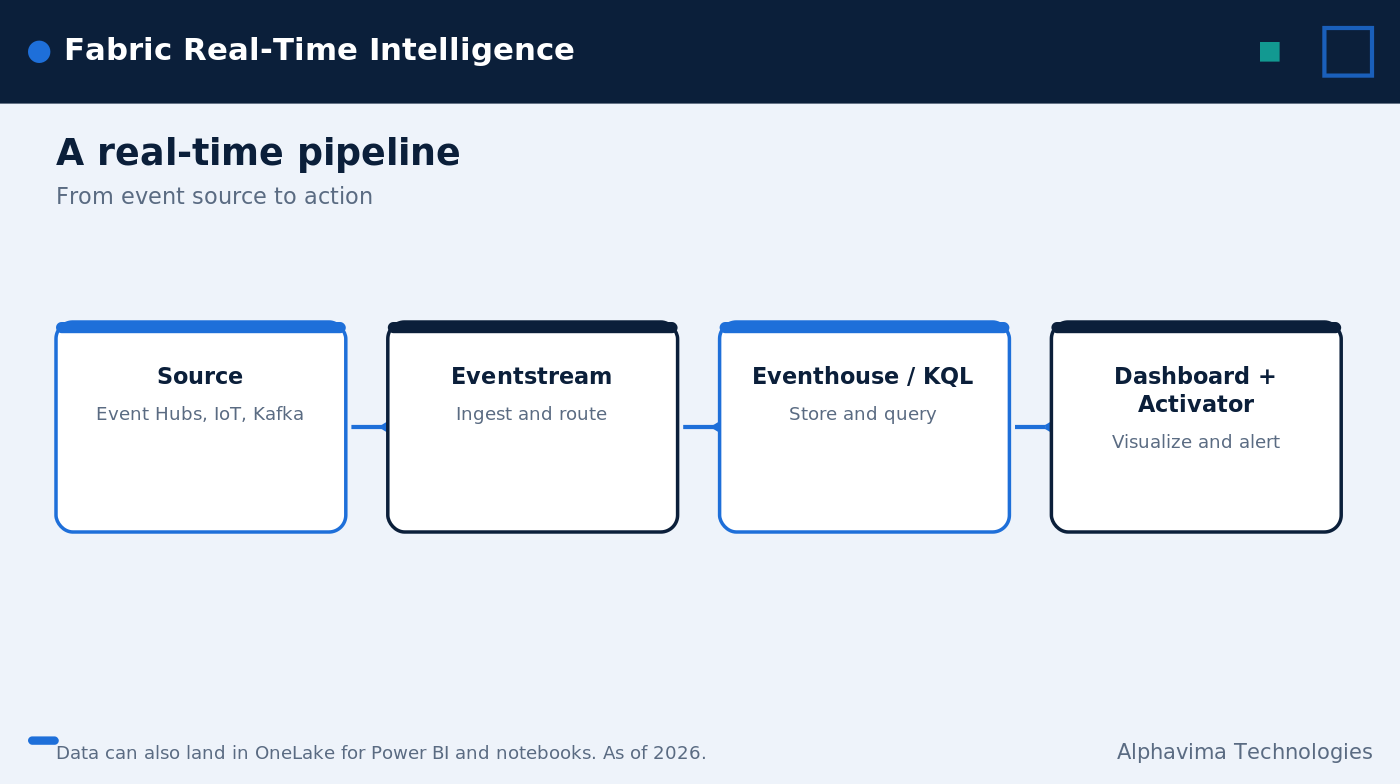
Fabric Real-Time Intelligence pipeline from event source to dashboard

What Fabric Real-Time Intelligence Covers

Real-Time Intelligence (RTI) handles event-driven scenarios from start to finish. It takes in streaming data and logs, stores them efficiently, lets you query them with Kusto Query Language (KQL), and then visualizes or acts on the results. Because everything sits inside Fabric, the same data can also land in OneLake, so Power BI (Direct Lake) and notebooks can read it too.

Real-time analytics in Fabric is built from a handful of components, and each one plays a clear role. Knowing what each does helps you pick the right piece for the job rather than forcing every problem through a single tool. The pieces also work together as a chain, so a clean design in one stage pays off in the next. For the official reference, see the Microsoft Learn overview of Real-Time Intelligence.

The Core Components

The table below lists the main parts of RTI, what each one does, and when to reach for it. Use it as a quick map before you start building.

ComponentWhat it doesWhen to use it
EventstreamIngests, processes, and routes real-time data with a low-code canvas; sources include Azure Event Hubs, Azure IoT Hub, Apache Kafka, database change data capture, and sample dataWhen you need to bring streaming data in and route it to a destination
Eventhouse / KQL databaseStores high-volume time-series and event data, queried with KQLWhen you need fast queries over large volumes of event data
Real-Time DashboardVisualizes streaming data with auto-refreshWhen stakeholders need a live view that updates on its own
Activator (Data Activator)Watches data and triggers alerts or actions when conditions or thresholds are metWhen a value crossing a limit should kick off a notification or action
Real-Time hubA central catalog of the streams available in your tenantWhen you want to find and reuse existing streams across teams

How to Build a Real-Time Pipeline, Step by Step

The build follows a clear path: bring data in, store it, query it, then act on it. Each step maps to one of the components above, so you can pause and verify before moving on. Working in this order also keeps troubleshooting simple, because you confirm one stage is healthy before adding the next. To follow the official walkthrough alongside this guide, see the Real-Time Intelligence tutorial introduction.

  1. Create an Eventhouse with a KQL database. This is where your event data will land and where you will run KQL queries. Set it up first so the eventstream has a destination ready.
  2. Create an Eventstream. Open the low-code canvas that handles ingestion and routing. The Microsoft Fabric eventstream is the front door for all incoming events.
  3. Add a source. Start with sample data to test the flow quickly, or connect a live source like Azure Event Hubs. Other sources include Azure IoT Hub, Apache Kafka, and database change data capture.
  4. Add the Eventhouse / KQL database as a destination. Point the stream at the storage you created in step one so events begin to accumulate.
  5. Add optional processing steps. On the canvas, you can filter out noise, aggregate values, or join streams before the data lands. Keep this light at first.
  6. Query the data with KQL and build a Real-Time Dashboard. Once events flow in, write KQL to shape the results, then pin them to a real-time dashboard in Fabric that auto-refreshes.
  7. Set an Activator rule. Tell Activator to watch a metric and alert you when a threshold is crossed, so the system reacts without anyone staring at a screen.

A Short KQL Example

KQL reads top to bottom, with each line piping its result into the next. The query below pulls the last hour of telemetry and averages temperature in five-minute buckets per device. You can adapt the column names to your own schema.

Telemetry
| where Timestamp > ago(1h)
| summarize avg(Temperature) by bin(Timestamp, 5m), DeviceId

This pattern, filter then summarize then group, covers a large share of real-world streaming questions. The ago(1h) filter keeps the query light by scanning only recent records, which matters when an Eventhouse holds billions of rows. The bin() function groups timestamps into even windows, so the chart shows a clean trend rather than jittery raw points. Once the query returns what you expect, pin it to your dashboard so the view stays current.

As your needs grow, you can extend the same query with extra filters, additional aggregations, or joins to reference tables. Because Eventhouse KQL is built for time-series workloads, these queries stay fast even as data volume climbs. Keep each dashboard tile focused on one question; several small, fast tiles read better than one crowded chart.
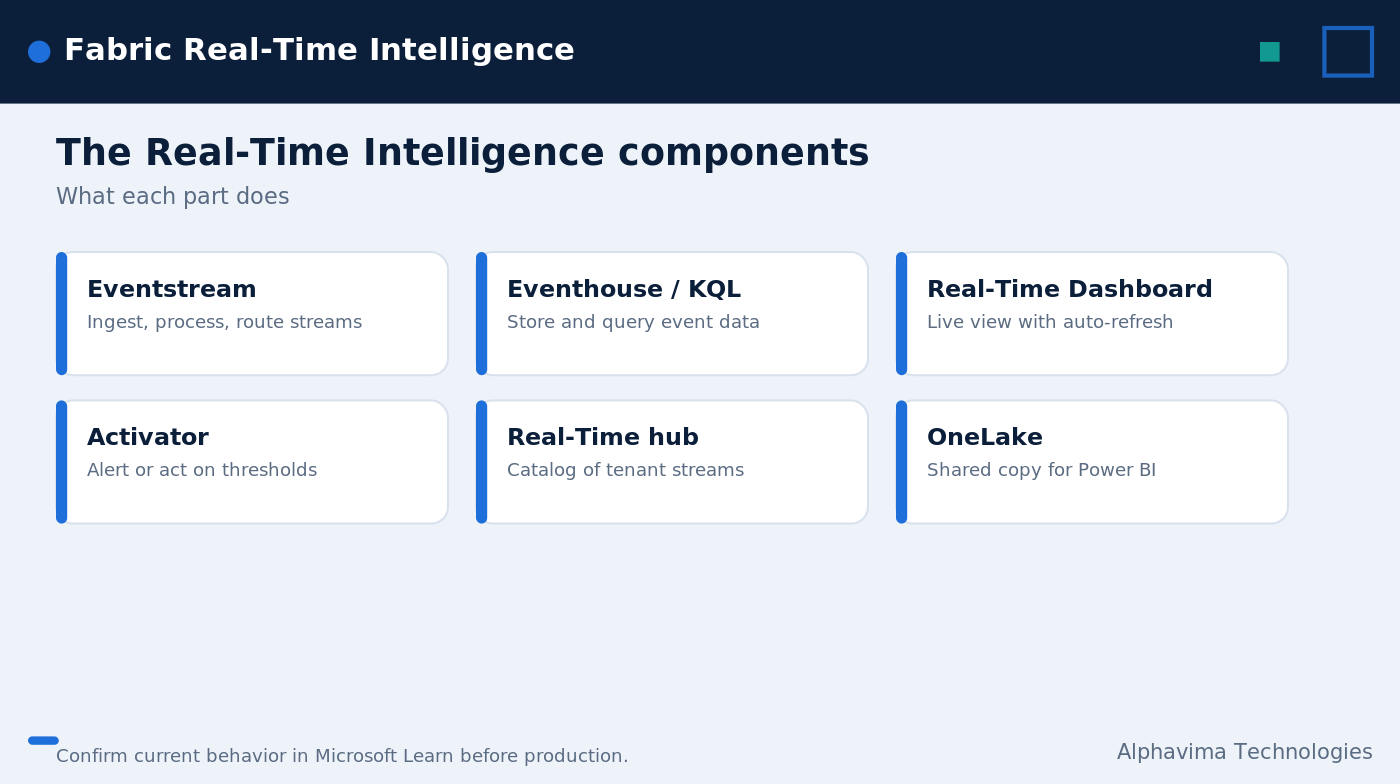
Real-time dashboard in Fabric with Activator alert on a threshold

Where the Eventstream Can Route Data

An eventstream is flexible about destinations. Besides an Eventhouse, it can route data to a lakehouse, which keeps your batch and streaming worlds close together. Many teams use both: an Eventhouse for fast queries on recent events, and a lakehouse for long-term storage and downstream modeling. Routing to more than one destination from a single stream means you do not have to choose between speed and history.

The low-code canvas also lets you shape data on its way through. A filter can drop noisy or irrelevant events early, an aggregation can pre-summarize high-frequency readings, and a join can attach reference data such as a device name or region. Keeping processing light at first makes the pipeline easier to debug, and you can add steps once the basic flow is proven. For more detail on sources and destinations, the Eventstream overview on Microsoft Learn is the reference to keep open while you build. If you are also working with batch and historical data, our note on the Microsoft Fabric lakehouse explains how the lakehouse pattern fits the wider platform.

Common Use Cases for Fabric Streaming Data

Fabric streaming data shows up across many operational problems. The components stay the same; only the source and the alert logic change. Because the build pattern repeats, a team that ships one use case can usually adapt it to the next with little rework. Here are the patterns we see most often:

  • IoT and sensor telemetry. Track temperature, vibration, or pressure from connected devices and flag readings that drift out of range. Manufacturing lines, cold-chain storage, and utilities all rely on this kind of continuous monitoring.
  • Logistics and shipment tracking. Follow packages and vehicles in motion and surface delays as they happen. Live position and status data lets dispatch teams reroute or notify customers before a problem grows.
  • Fraud and anomaly detection. Spot unusual transactions or behavior and trigger a review before damage spreads. Speed matters here, since a few seconds can be the difference between blocking a charge and absorbing a loss.
  • Application and log monitoring. Watch service logs for error spikes and respond to incidents faster. Pairing log streams with Activator alerts gives engineering teams an early warning rather than a postmortem.
  • Live operations dashboards. Give a control room or operations team a current picture instead of a stale report. Auto-refresh keeps everyone looking at the same numbers as conditions change.

A useful way to scope a first project is to pick one of these patterns and define a single alert worth acting on. For sensor telemetry, that might be a reading above a safe limit. For log monitoring, it might be an error count that spikes within a short window. Starting narrow keeps the build focused and gives you a clear win to show stakeholders before you expand the pipeline.

Because the data can also land in OneLake, these same feeds support deeper analysis later. A live feed answers the immediate question, while the historical copy supports trend analysis, forecasting, and model training down the line. Pairing real-time analytics in Fabric with AI assistance is becoming common too; our overview of Copilot in Microsoft Fabric covers how that helps practitioners move faster. For a wider view of where the platform is heading, see our take on the future of data analytics with Microsoft Fabric.

Tips for a Reliable Real-Time Pipeline

A working pipeline is the first goal, but a few habits keep Fabric Real-Time Intelligence dependable as it grows. Treat these as guardrails rather than rules, and adjust them to fit your data volume and team.

Start With Sample Data, Then Connect a Live Source

Sample data lets you confirm the full path, from eventstream to dashboard, before you wire up a production feed. Once the flow works from start to finish, swap in a real source such as Azure Event Hubs. This habit catches setup mistakes early, when they are cheap to fix.

Filter Early and Keep Queries Scoped

Drop events you do not need at the eventstream stage rather than after they land. On the query side, always bound your KQL with a time filter so each run scans only the window you care about. Scoped queries keep a real-time dashboard in Fabric responsive even as the Eventhouse fills with months of history.

Set Clear Thresholds Before You Add Alerts

An Activator rule is only as good as the threshold behind it. Agree on what counts as normal and what counts as a problem before you turn on alerts, or your team will learn to ignore the noise. Start with a small number of high-value alerts and add more once they prove useful.

Plan for Both Fast and Historical Data

Route to an Eventhouse for quick queries and to a lakehouse or OneLake for long-term storage. That split lets Fabric streaming data serve live monitoring and deeper analysis without forcing a trade-off between the two.

Need real-time analytics in Microsoft Fabric?

Alphavima builds streaming pipelines, KQL, and live dashboards your operations team will rely on.

Conclusion

Fabric Real-Time Intelligence gives you a clear, repeatable way to move from raw event feeds to live dashboards and automated alerts, all inside one platform. Start with sample data, build an eventstream into an Eventhouse, write a little KQL, then add an Activator rule to close the loop.

Alphavima works as a Microsoft Fabric data partner, helping teams design real-time pipelines, write reliable KQL, and stand up dashboards that operations teams can trust. If you want help planning or building your streaming setup, explore our Microsoft Fabric services and let us map the right approach for your data.

FAQs

What is Fabric Real-Time Intelligence used for?

Fabric Real-Time Intelligence is used to ingest, store, query, and act on streaming data and logs. It suits event-driven scenarios such as IoT telemetry, fraud detection, and live operations dashboards, where waiting for a batch run is not an option.

What is the difference between Eventstream and Eventhouse?

Eventstream is the ingestion and routing layer; it brings data in from sources and sends it to a destination. Eventhouse, with its KQL database, is the storage layer built for high-volume time-series and event data. You use Eventhouse KQL to query what the eventstream delivers.

Do I need to know KQL to use real-time analytics in Fabric?

Some KQL helps a great deal, since it is how you query event data and shape dashboard visuals. The language is approachable, and the filter-summarize-group pattern shown above covers many common questions. You can start small and grow your skills as needs expand.

How does Activator fit into the pipeline?

Activator watches your data and triggers an alert or action when a condition or threshold is met. It lets the pipeline respond on its own, so a temperature spike or an error surge can page a team without anyone monitoring a screen.

Can streaming data reach Power BI?

Yes. Data can land in OneLake, so Power BI using Direct Lake and Fabric notebooks can read the same event data. This keeps a real-time dashboard in Fabric and your wider Power BI reporting aligned on one copy of the data.

What sources can an eventstream connect to?

A Microsoft Fabric eventstream can pull from Azure Event Hubs, Azure IoT Hub, Apache Kafka, database change data capture, and sample data. Sample data is a quick way to test the flow before you wire up a live source.

Are these features still changing?

Yes, Fabric features continue to evolve. The components and steps here reflect 2026, so confirm current behavior in Microsoft Learn before you finalize a production design.

    Get in Touch