











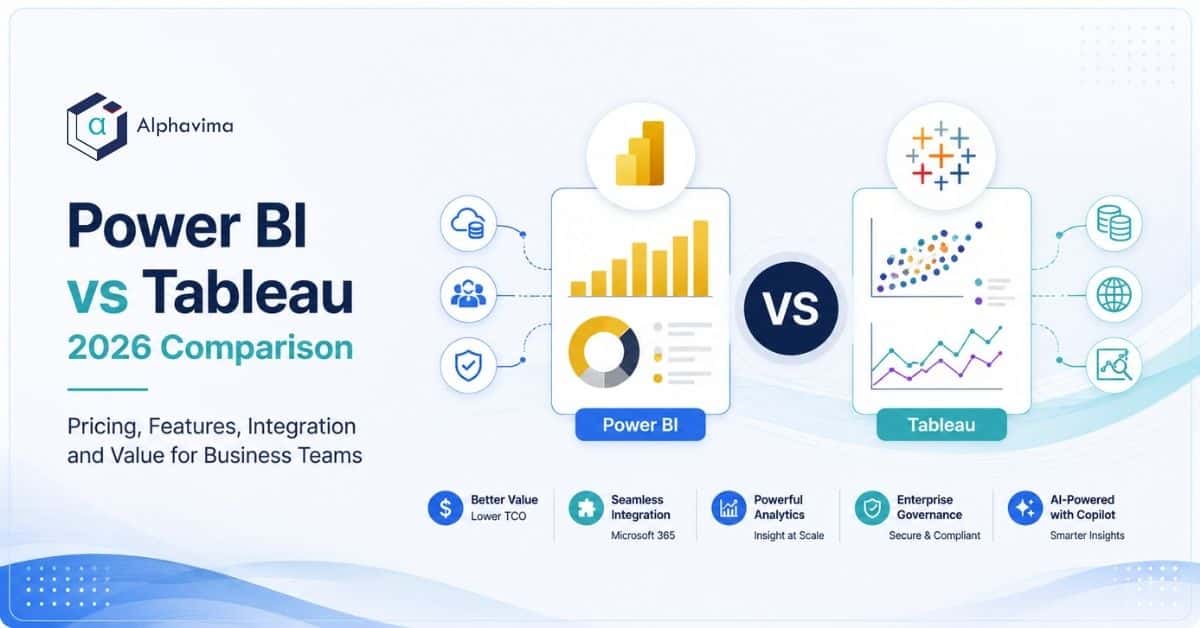
Choosing between Microsoft Power BI and Tableau is one of the more consequential analytics decisions a business team makes, because the tool you pick shapes how people build reports, what they pay every month, and how easily insight spreads across the organisation.
Both are mature, capable platforms sitting near the top of every analyst ranking, so this is rarely a case of one being right and the other wrong.
This comparison is written for business and IT buyers who need a clear, honest read rather than a sales pitch. We look at 2026 pricing (verified against the vendors’ own pages), Microsoft 365 and ecosystem fit, ease of use, data connectivity, visual and analytical depth, governance, and where Copilot changes the picture.
Tableau has genuine strengths, and we name them.
Key takeaway / What you’ll learn: Power BI usually wins on price and Microsoft 365 integration, while Tableau leads on advanced visual analytics and cross-platform neutrality. The right choice depends on your existing stack, your users’ skill level, and how far you need visualisation to go.
Table of contents
Talk to a Power BI consultant
Book a quick call to talk through your Power BI project. No pressure, just practical advice. Or see our Microsoft Fabric and Power BI services.
At a glance: Power BI vs Tableau
| Factor | Microsoft Power BI | Tableau |
|---|---|---|
| Entry per-user price | Power BI Pro at $14 user/month | Viewer at $15 user/month |
| Full author price | Premium Per User at $24 user/month | Creator at $75 user/month |
| Capacity option | Microsoft Fabric capacity (F SKUs) | Tableau Server / Cloud capacity |
| Best for | Microsoft-centric teams, cost at scale | Analyst-led, visualisation-heavy teams |
| Ecosystem | Deep Microsoft 365, Azure, Fabric ties | Broad, vendor-neutral, multi-cloud |
| Learning curve | Gentle for Excel users | Intuitive drag-and-drop, deep to master |
| Visual depth | Strong, improving each release | Class-leading, highly flexible |
| AI assistant | Copilot in Power BI | Tableau Pulse and Agent (Einstein) |
| Governance | Fabric, Purview, Entra ID native | Tableau governance, Salesforce-aligned |
| Ideal company size | SMB to large enterprise | Mid-market to large enterprise |
Prices above are per user, billed annually, taken from the official Power BI pricing page and Tableau pricing page in 2026. Always confirm the current figure before you buy, as both vendors adjust pricing periodically.
2026 pricing, side by side
Pricing is where the two platforms diverge most, and it is usually the first thing a finance stakeholder asks about.
Power BI licensing
Power BI has three main commercial paths:
- Power BI Pro at $14 per user per month (billed annually). This lets a user author, publish and share reports in a workspace, and it is the entry point for most collaborative teams.
- Premium Per User (PPU) at $24 per user per month. PPU adds larger models, more frequent refreshes, paginated reports, and advanced AI features on a per-seat basis, without committing to dedicated capacity.
- Microsoft Fabric capacity (F SKUs) for organisations that want to buy compute rather than seats. Fabric capacity is priced variably, with reserved (annual) and pay-as-you-go options, and a Power BI Pro licence is still required to publish content. At the F64 capacity tier and above, report viewers can consume content without individual per-user licences, which is what makes Power BI so economical for large read-only audiences.
For a deeper look at how Fabric capacity is costed, our Microsoft Fabric services team can model the tier that fits your workload.
Tableau licensing
Tableau uses a role-based model with three seat types, priced here for the Tableau Cloud Standard edition (billed annually):
- Creator at $75 per user per month. Creators get full authoring, data prep with Tableau Prep, and connection building.
- Explorer at $42 per user per month. Explorers edit and interact with existing content but do not build new data connections from scratch.
- Viewer at $15 per user per month. Viewers consume and interact with published dashboards. Since July 2026 Tableau has also offered capacity-based Viewer blocks, which licence viewing by concurrent usage rather than by named user, so check the Tableau pricing page for the model that applies to you.
Tableau also offers Enterprise editions at higher rates (for example, Creator at $115 per user per month) with added security, management and data-management capabilities.
Note: The headline gap looks dramatic, a full Power BI author at $24 versus a Tableau Creator at $75, but the honest comparison depends on your mix of authors and viewers. Tableau’s Viewer at $15 is competitive, and at very large read-only scale Power BI’s Fabric capacity model can undercut per-seat pricing on either side.
Model your own user mix rather than trusting a single headline number.
Microsoft 365 and ecosystem integration
This is Power BI’s clearest structural advantage. If your organisation already runs on Microsoft 365, Azure, Dynamics 365 or Microsoft Fabric, Power BI slots in with almost no friction.
Reports embed directly into Teams channels and SharePoint pages, security is governed through the same Microsoft Entra ID identities you already manage, and datasets sit alongside your OneLake and Fabric data without a separate integration layer.
For a Dynamics 365 or Business Central shop, Power BI is the native reporting surface, and the shared semantic model means finance and operations teams work from the same numbers.
Tableau is not weak here, it connects to Microsoft sources perfectly well, but it does so as an external party rather than a first-class member of the stack. Where Tableau earns its keep is neutrality.
If you run a multi-cloud estate spanning AWS, Google Cloud and Snowflake, or you deliberately want a BI layer that is not tied to any one platform vendor, Tableau’s independence is a real, deliberate benefit rather than an afterthought.
Since its acquisition by Salesforce, Tableau also has strong ties into the Salesforce and Einstein ecosystem.
Ease of use and learning curve
Both tools are approachable, but they are approachable in different ways.
Power BI feels familiar to anyone who has lived in Excel. Power Query for data shaping, DAX for calculations, and a report canvas that behaves much like Office all lower the barrier for business analysts moving up from spreadsheets. The trade-off is that DAX has a genuine learning curve once you move beyond simple measures.
Tableau is widely regarded as the more intuitive tool for pure visual exploration. Its drag-and-drop model lets an analyst drop a field onto a shelf and immediately see a well-formed chart, which is why data-curious users often build their first meaningful dashboard in Tableau faster.
Tableau is easy to start and deep to master, and that depth is precisely what advanced users value.
Tip: Match the tool to your people, not the other way round. Excel-heavy finance and operations teams tend to ramp faster on Power BI; dedicated analysts and data-visualisation specialists often prefer Tableau’s canvas.
Data connectivity
Both platforms connect to a very wide range of sources, from cloud warehouses to flat files to SaaS APIs, and for most common databases either will do the job.
Power BI’s connectivity is strongest inside the Microsoft and Fabric world, with tight links to Azure Synapse, OneLake, Dataverse and SQL Server, plus DirectQuery and Import modes to balance freshness against performance. Where source data needs cleaning, modelling or consolidating before it reaches a report, that work belongs in a proper pipeline, and our data engineering services team builds exactly that foundation so dashboards are fast and trustworthy.
Tableau’s connector library is broad and vendor-neutral, and Tableau Prep gives analysts a visual way to shape data without leaving the tool. For heterogeneous environments where data lives across many clouds and vendors, Tableau’s even-handed connectivity is an advantage.
Visual and analytical depth
Here is where Tableau has a legitimate edge, and it would be dishonest to pretend otherwise.
Tableau was built around visualisation first, and it shows. For complex, custom, exploratory visuals, granular formatting control, and analyst-driven “what does this data want to tell me” investigation, Tableau remains the reference standard.
Teams whose core job is visual analytics, and who will push a chart well beyond the defaults, tend to hit fewer walls in Tableau.
Power BI has closed much of the gap and is strong for standard business reporting, KPIs, and dashboards, with a large marketplace of custom visuals. For the reporting most organisations actually need, day to day operational and financial dashboards, Power BI is more than sufficient, and its modelling layer (DAX and the semantic model) is powerful.
But for the most demanding, bespoke visual work, Tableau still leads.
Governance and security
Governance is where the platform decision meets the risk and compliance conversation.
Power BI’s governance is native to the Microsoft stack. Sensitivity labels flow through Microsoft Purview, identity and access run on Entra ID, and row-level security lets you show each user only the rows they are entitled to see.
If you need to control who sees which records inside a shared report, our guide to Power BI row-level security setup walks through the practical steps. For regulated organisations already standardised on Microsoft compliance tooling, this shared control plane is a strong reason to consolidate on Power BI.
Tableau offers robust governance too, with permissions, data governance features and, in Enterprise editions, added data-management and security controls. Aligned with Salesforce, it fits organisations that treat Salesforce as their system of record. The difference is less about capability and more about which control plane you want to standardise on.
Copilot and AI
AI assistance has become a real differentiator rather than a demo feature.
Copilot in Power BI lets users generate report pages, write and explain DAX measures, and ask questions of their data in natural language, and it is tied into the wider Microsoft Copilot fabric that spans Microsoft 365 and Fabric.
Microsoft’s Copilot in Power BI documentation covers current capabilities and the licensing or capacity needed to use them. For organisations already investing in Copilot across their Microsoft estate, having the same assistant inside their BI tool is a coherent, low-friction advantage.
Tableau answers with Tableau Pulse for proactive, personalised metrics and its Agent capabilities built on Salesforce Einstein, bringing natural-language insight and AI-guided analysis into the Tableau experience. Both vendors are investing heavily here, so treat AI as a fast-moving area and re-check current capabilities at purchase time.
Get help choosing and rolling out your BI platform
Whether it is Power BI licensing, Fabric capacity or a Tableau migration, our team will help you choose and implement the right fit.
Which should you choose?
There is no universal winner, but the decision usually resolves cleanly once you know your context.
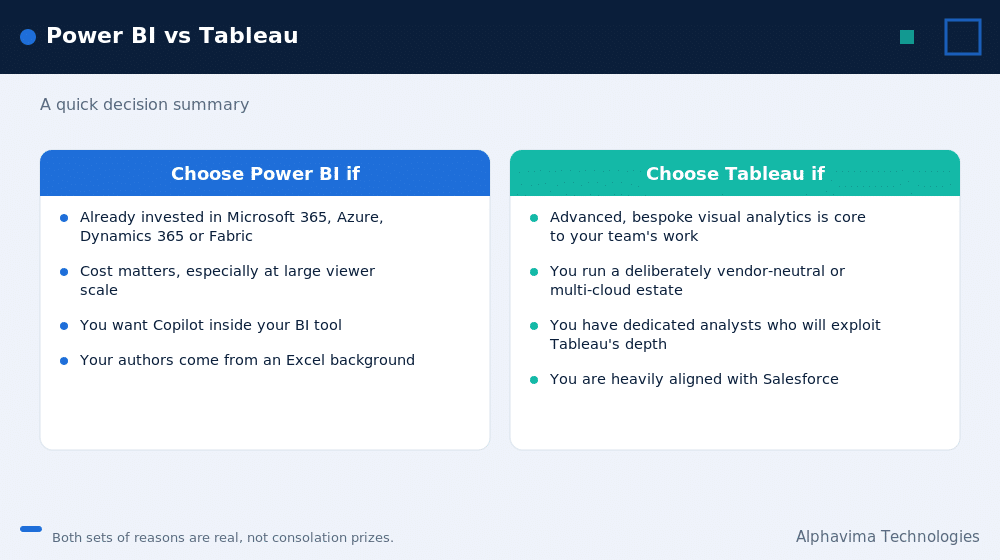
Choose Power BI if: you are already invested in Microsoft 365, Azure, Dynamics 365 or Fabric; cost matters, especially at large viewer scale; you want Copilot inside your BI tool; and your authors come from an Excel background.
This covers a large share of mid-market and enterprise buyers, and it is why Power BI is often the default for Microsoft-shaped organisations. Our Power Platform services team helps teams stand it up properly.
Choose Tableau if: advanced, bespoke visual analytics is core to what your team does; you run a deliberately vendor-neutral or multi-cloud estate; you have dedicated analysts who will exploit Tableau’s depth; or you are heavily aligned with Salesforce. These are real, defensible reasons, not consolation prizes.
For many organisations the deciding factor is simply gravity, which ecosystem they already live in, and the total cost across their real mix of authors and viewers.
Conclusion
Power BI and Tableau are both excellent, and the honest answer to “which is better” is “it depends on your context.” Power BI tends to win on price, Microsoft 365 and Fabric integration, and Copilot, which makes it the natural fit for Microsoft-centric organisations.
Tableau leads on advanced visual analytics and vendor neutrality, which matters for analyst-heavy teams and multi-cloud estates.
The best way to decide is to weigh your existing ecosystem, your users’ skills, and the total cost across your real mix of authors and viewers, rather than a single sticker price. Prices and AI features move, so confirm current figures on the vendors’ pricing pages before you commit.
Ready to move forward? If you want help modelling Power BI licensing, Fabric capacity, or a Tableau-to-Power BI migration for your team, contact the Alphavima team through our Power Platform services page and we’ll help you choose and implement the right fit.

Related case study
CTOS Unifies Reporting & Data Warehouse with Power BI
Custom Truck One Source replaced 15 days of manual reporting with automated, real-time Power BI dashboards across multiple ERPs.
Read the case study · Next read: Microsoft Fabric pricing in 2026
Frequently asked questions
Is Power BI cheaper than Tableau?
For most teams, yes, at the authoring level. A full Power BI author on Premium Per User is $24 per user per month, versus a Tableau Creator at $75 per user per month on Tableau Cloud Standard. At the viewer level the gap narrows ($14 Power BI Pro or Fabric capacity consumption versus $15 Tableau Viewer), so model your own user mix before deciding.
Which is easier to learn, Power BI or Tableau?
Power BI is easier for people with an Excel background because it reuses familiar concepts like Power Query. Tableau is often faster for pure visual exploration thanks to its drag-and-drop canvas. Both reward practice, and Power BI’s DAX language has a real learning curve for advanced calculations.
Does Power BI have better Microsoft 365 integration?
Yes, decisively. Power BI is a native member of the Microsoft stack, embedding into Teams and SharePoint, using Entra ID for security, and sharing data with Microsoft Fabric and OneLake. Tableau connects to Microsoft sources well but as an external tool rather than a first-class part of the ecosystem.
Is Tableau better for data visualisation?
For advanced, custom and exploratory visualisation, Tableau still leads and is considered the reference standard. Power BI is very capable for standard business dashboards and KPIs and has closed much of the gap, but the most demanding bespoke visual work tends to be easier in Tableau.
What is Microsoft Fabric capacity and how does it affect Power BI cost?
Fabric capacity (the F SKUs) lets you buy compute rather than individual seats, with reserved and pay-as-you-go pricing. At F64 and above, report viewers can consume Power BI content without per-user licences, which makes Power BI very economical for large read-only audiences. A Power BI Pro licence is still needed to publish.
Does Tableau work with Microsoft data sources?
Yes. Tableau connects to SQL Server, Azure, Excel and other Microsoft sources without issue, and Tableau Prep helps shape that data. Its connectivity is deliberately vendor-neutral, which is an advantage in multi-cloud environments spanning AWS, Google Cloud and Snowflake.
How do Copilot in Power BI and Tableau’s AI compare?
Copilot in Power BI generates reports, writes and explains DAX, and answers natural-language questions, tied into the wider Microsoft Copilot ecosystem. Tableau offers Pulse for proactive metrics and Agent capabilities built on Salesforce Einstein. Both are advancing quickly, so verify current features at purchase time.
Can I use both Power BI and Tableau together?
Yes, and some organisations do, using Tableau for specialist analyst-led visualisation and Power BI for broad, integrated business reporting. It adds licensing and governance overhead, so most teams eventually standardise on one platform for the bulk of their reporting.